This report summarizes the statistics for the Western Region of the Southern Georgian Bay Association of REALTORS® (SGBAR). The Western Region includes Clearview Township, Collingwood, The Blue Mountains, Municipality of Meaford, Wasaga Beach, Springwater & Grey Highlands.
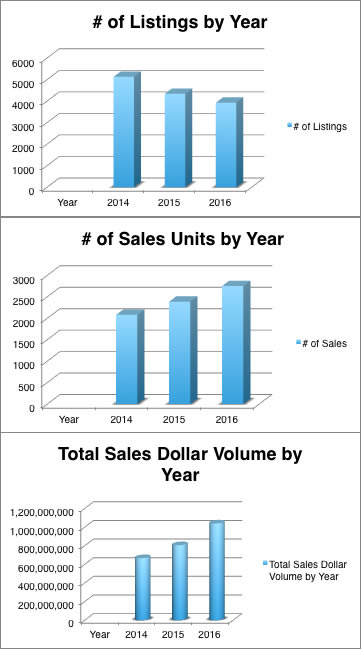
The Southern Georgian Bay Western region 2016 real estate market ended another record setting year. Listing inventory remained low throughout 2016 and sales dollar increased month over month throughout the year to set an all-time record year for sales in the Western Region. The number of unit sales were up 15.3% over 2015 and the dollar volume broke the BILLION dollar barrier – up by 29% closing out at $1,037,827,103 (compared to 2015 at $804,882,436). The number of new listings were down by -9.5% from 4339 (December 2015) to 3928. The monthly sales to listing ratio for 2016 was 70.01% compared to 54.99% over 2015.
The number of sales by price range saw the largest increase in the price range of $900,000 to $999,999, up 93.3% from 15 units in 2015 to 29 unit sales in 2016. The $1 million to 2 million and $500,000 to $599,999 ranges both followed with 75.% over 2015 unit sales.
| Number of Units Sold by Price | 2016 | 2015 | % Change |
| Year | Year | ||
| Under $200,000 | 541 | 566 | -4.42% |
| 200,000 – $299,00 | 700 | 735 | -4.76% |
| 300,000 – $399,000 | 633 | 524 | 20.8% |
| $400,00 – $499,000 | 362 | 234 | 54.7% |
| $500,000 – $599,999 | 188 | 107 | 75.7% |
| $600,000 – $699,000 | 119 | 80 | 48.75% |
| $700,000 – $799,999 | 52 | 45 | 15.5% |
| $800,000 – $899,999 | 44 | 32 | 37.5% |
| $900,000 – 999,999 | 29 | 15 | 93.3% |
| 1,000,000 – 1,999,999 | 68 | 39 | 74.35% |
| 2,000,000 – 2,999,999 | 12 | 9 | 33.33% |
| 3,000,000+ | 2 | 0 |
Residential (Single Family) 2016 Totals
Clearview
- # Listings 300 – up 6.76% (2015 – 281)
- # of Sales – 209 Units, up 32.3% (2015 – 158)
- 12 Month Average Price $486,144 up 34.1%(2015 – $362,513)
- Monthly Sales to Listing Ratio 70% (2015 56%)
Collingwood
- # Listings 459 – down -8.2% (2015 – 500)
- 381 Units, up 5.8% (2015 – 360)
- 12 Month Average Price $440,176 up 19% (2015 – $339,818)
- Monthly Sales to Listing Ratio 83% (2015 -72%)
Grey Highlands
- # Listings 116 – down -9.37% (2015 – 128)
- 71 Units, up 18.3% (2015 – 60)
- 12 Month Average Price $480,736 up 20.1% (2015 – $400,128)
- Monthly Sales to Listing Ratio 61% (2015 – 47%)
Municipality of Meaford
- # Listings 215 – down -19.17% (2015 – 266)
- 166 Units, up 19.4% (2015 – 139)
- 12 Month Average Price $351,115 up 13.1% (2015 – $310,564)
- Monthly Sales to Listing Ratio 77% (2015 – 52%)
The Blue Mountains
- # Listings 337 – down -50% (2015 – 407)
- 213 Units, up 3.4% (2015 – 206)
- 12 Month Average Price $666,609 up 7.5% (2015 – $620,085)
- Monthly Sales to Listing Ratio 63% (2015 – 51%)
Wasaga Beach
- # Listings 746 – down -16.92% (2015 – 898)
- 643 Units, up 13.2% (Dec. YTD 2015 – 568)
- 12 Month Average Price $355,595 up 13.9% (2015 – $312,207)
- Monthly Sales to Listing Ratio 86% (2015 63%)